
【转至: http://goog-perftools.sourceforge.net/doc/heap_profiler.html 】
Profiling heap usage
This document describes how to profile the heap usage of a C++ program. This facility can be useful for
- Figuring out what is in the program heap at any given time
- Locating memory leaks
- Finding places that do a lot of allocation
Linking in the Heap Profiler
You can profile any program that has the tcmalloc library linked in. No recompilation is necessary to use the heap profiler.
It's safe to link in tcmalloc even if you don't expect to heap-profiler your program. Your programs will not run any slower as long as you don't use any of the heap-profiler features.
You can run the heap profiler on applications you didn't compile yourself, by using LD_PRELOAD:
$ LD_PRELOAD="/usr/lib/libtcmalloc.so" HEAPPROFILE=...
We don't necessarily recommend this mode of usage.
Turning On Heap Profiling
Define the environment variable HEAPPROFILE to the filename to dump the profile to. For instance, to profile /usr/local/netscape:
 $ HEAPPROFILE=/tmp/profile /usr/local/netscape           # sh
 % setenv HEAPPROFILE /tmp/profile; /usr/local/netscape   # csh
Profiling also works correctly with sub-processes: each child process gets its own profile with its own name (generated by combining HEAPPROFILE with the child's process id).
For security reasons, heap profiling will not write to a file -- and it thus not usable -- for setuid programs.
Extracting a profile
If heap-profiling is turned on in a program, the program will periodically write profiles to the filesystem. The sequence of profiles will be named:
           <prefix>.0000.heap
           <prefix>.0001.heap
           <prefix>.0002.heap
           ...
where <prefix> is the value supplied in HEAPPROFILE. Note that if the supplied prefix does not start with a /, the profile files will be written to the program's working directory.
By default, a new profile file is written after every 1GB of allocation. The profile-writing interval can be adjusted by calling HeapProfilerSetAllocationInterval() from your program. This takes one argument: a numeric value that indicates the number of bytes of allocation between each profile dump.
You can also generate profiles from specific points in the program by inserting a call to HeapProfile(). Example:
    extern const char* HeapProfile();
    const char* profile = HeapProfile();
    fputs(profile, stdout);
    free(const_cast<char*>(profile));
What is profiled
The profiling system instruments all allocations and frees. It keeps track of various pieces of information per allocation site. An allocation site is defined as the active stack trace at the call to malloc, calloc, realloc, or, new.
Interpreting the profile
The profile output can be viewed by passing it to the pprof tool. The pprof tool can print both CPU usage and heap usage information. It is documented in detail on the CPU Profiling page. Heap-profile-specific flags and usage are explained below.
Here are some examples. These examples assume the binary is named gfs_master, and a sequence of heap profile files can be found in files named:
  profile.0001.heap
  profile.0002.heap
  ...
  profile.0100.heap
Why is a process so big
% pprof --gv gfs_master profile.0100.heap
This command will pop-up a gv window that displays the profile information as a directed graph. Here is a portion of the resulting output:
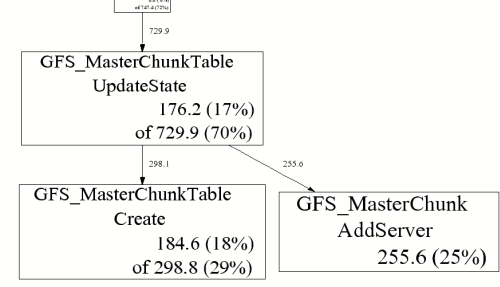

A few explanations:
GFS_MasterChunk::AddServeraccounts for 255.6 MB of the live memory, which is 25% of the total live memory.GFS_MasterChunkTable::UpdateStateis directly accountable for 176.2 MB of the live memory (i.e., it directly allocated 176.2 MB that has not been freed yet). Furthermore, it and its callees are responsible for 729.9 MB. The labels on the outgoing edges give a good indication of the amount allocated by each callee.
Comparing Profiles
You often want to skip allocations during the initialization phase of a program so you can find gradual memory leaks. One simple way to do this is to compare two profiles -- both collected after the program has been running for a while. Specify the name of the first profile using the --base option. Example:
% pprof --base=profile.0004.heap gfs_master profile.0100.heap
The memory-usage in profile.0004.heap will be subtracted from the memory-usage in profile.0100.heap and the result will be displayed.
Text display
% pprof gfs_master profile.0100.heap
   255.6  24.7%  24.7%    255.6  24.7% GFS_MasterChunk::AddServer
   184.6  17.8%  42.5%    298.8  28.8% GFS_MasterChunkTable::Create
   176.2  17.0%  59.5%    729.9  70.5% GFS_MasterChunkTable::UpdateState
   169.8  16.4%  75.9%    169.8  16.4% PendingClone::PendingClone
    76.3   7.4%  83.3%     76.3   7.4% __default_alloc_template::_S_chunk_alloc
    49.5   4.8%  88.0%     49.5   4.8% hashtable::resize
   ...
- The first column contains the direct memory use in MB.
- The fourth column contains memory use by the procedure and all of its callees.
- The second and fifth columns are just percentage representations of the numbers in the first and fifth columns.
- The third column is a cumulative sum of the second column (i.e., the
kth entry in the third column is the sum of the firstkentries in the second column.)
Ignoring or focusing on specific regions
The following command will give a graphical display of a subset of the call-graph. Only paths in the call-graph that match the regular expression DataBuffer are included:
% pprof --gv --focus=DataBuffer gfs_master profile.0100.heap
Similarly, the following command will omit all paths subset of the call-graph. All paths in the call-graph that match the regular expression DataBuffer are discarded:
% pprof --gv --ignore=DataBuffer gfs_master profile.0100.heap
Total allocations + object-level information
All of the previous examples have displayed the amount of in-use space. I.e., the number of bytes that have been allocated but not freed. You can also get other types of information by supplying a flag to pprof:
--inuse_space |
Display the number of in-use megabytes (i.e. space that has been allocated but not freed). This is the default. |
--inuse_objects |
Display the number of in-use objects (i.e. number of objects that have been allocated but not freed). |
--alloc_space |
Display the number of allocated megabytes. This includes the space that has since been de-allocated. Use this if you want to find the main allocation sites in the program. |
--alloc_objects |
Display the number of allocated objects. This includes the objects that have since been de-allocated. Use this if you want to find the main allocation sites in the program. |
Caveats
-
Heap profiling requires the use of libtcmalloc. This requirement may be removed in a future version of the heap profiler, and the heap profiler separated out into its own library.
-
If the program linked in a library that was not compiled with enough symbolic information, all samples associated with the library may be charged to the last symbol found in the program before the libary. This will artificially inflate the count for that symbol.
-
If you run the program on one machine, and profile it on another, and the shared libraries are different on the two machines, the profiling output may be confusing: samples that fall within the shared libaries may be assigned to arbitrary procedures.
-
Several libraries, such as some STL implementations, do their own memory management. This may cause strange profiling results. We have code in libtcmalloc to cause STL to use tcmalloc for memory management (which in our tests is better than STL's internal management), though it only works for some STL implementations.
-
If your program forks, the children will also be profiled (since they inherit the same HEAPPROFILE setting). Each process is profiled separately; to distinguish the child profiles from the parent profile and from each other, all children will have their process-id attached to the HEAPPROFILE name.
-
Due to a hack we make to work around a possible gcc bug, your profiles may end up named strangely if the first character of your HEAPPROFILE variable has ascii value greater than 127. This should be exceedingly rare, but if you need to use such a name, just set prepend
./to your filename:HEAPPROFILE=./Ägypten.
Sanjay Ghemawat
Last modified: Wed Apr 20 05:46:16 PDT 2005
原文链接: https://www.cnblogs.com/Lipp/archive/2012/05/28/2521379.html
欢迎关注
微信关注下方公众号,第一时间获取干货硬货;公众号内回复【pdf】免费获取数百本计算机经典书籍

原创文章受到原创版权保护。转载请注明出处:https://www.ccppcoding.com/archives/51382
非原创文章文中已经注明原地址,如有侵权,联系删除
关注公众号【高性能架构探索】,第一时间获取最新文章
转载文章受原作者版权保护。转载请注明原作者出处!