
AutoCAD Civil 3D .Net二次开发一书中第11.2节使用customdraw实现了纵断面图标尺的显示,
对于不熟悉c++的用户来说,
掌握这部分内容有些困难,
今天就用另一种方式来实现同样的功能。

这里涉及到的主要方法与前一篇帖子类似,
都是使用的DrawableOverrule。
话不多数,
直接上代码。
相对于书中c++代码,
代码要简单不少。
需要注意的是有些参数的获取方式及对象的属性值有所变化,
所以下面的代码与书中的c++并不完全相同。
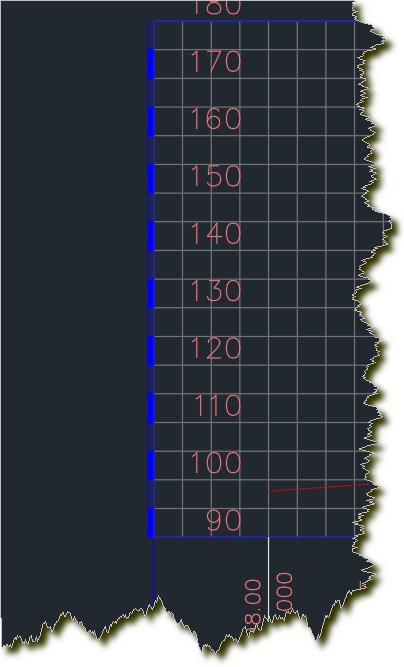
上面截图就是用以下代码实现的,
有需要的朋友可以在此基础上修修改改来实现自己的需求,
直接拿走,
不用谢!
public class ProfileViewOverrule : DrawableOverrule
    {
        Document doc;
        CivilDocument civilDoc;
        double m_CannoScale;
        double m_Scale = 1;
        Point3d axOriginPoint;
        public override bool WorldDraw(Autodesk.AutoCAD.GraphicsInterface.Drawable drawable, Autodesk.AutoCAD.GraphicsInterface.WorldDraw wd)
        {
            doc = Autodesk.AutoCAD.ApplicationServices.Application.DocumentManager.MdiActiveDocument;
            civilDoc = CivilApplication.ActiveDocument;
            m_CannoScale = doc.Database.Cannoscale.Scale;

            var ut = civilDoc.Settings.DrawingSettings.UnitZoneSettings.DrawingUnits;
            if (ut == DrawingUnitType.Feet)
            {
                m_Scale = 12;
            }
            else if (ut == DrawingUnitType.Meters)
            {
                m_Scale = 1000;
            }


            ProfileView pv = (ProfileView)drawable;
            if (pv == null) return base.WorldDraw(drawable, wd);

            var pos = pv.GraphOverrides;
            var ge = pv.GeometricExtents;
            axOriginPoint = ge.MinPoint;
            //var maxEle = pv.ElevationMax;
            //var minEle = pv.ElevationMin;
            var maxEle = ge.MaxPoint.Y;
            var minEle = ge.MinPoint.Y;


            var styId = pv.StyleId;
            if (styId == null) return base.WorldDraw(drawable, wd);

            Color color = Color.FromColorIndex(ColorMethod.ByLayer, 192);
            string layerName;
            double l = 1;
            double w = 1;
            double vs = 1;
            using (Transaction tr = doc.TransactionManager.StartTransaction())
            {
                var sty = styId.GetObject(OpenMode.ForRead) as ProfileViewStyle;
                if (sty != null)
                {
                    color = sty.GetDisplayStylePlan(ProfileViewDisplayStyleType.LeftAxisTicksMinor).Color;
                    layerName = sty.GetDisplayStylePlan(ProfileViewDisplayStyleType.LeftAxisTicksMinor).Layer;
                    l = sty.LeftAxis.MinorTickStyle.Interval;
                    w = sty.LeftAxis.MinorTickStyle.Size;
                    vs = sty.GraphStyle.VerticalExaggeration;
                }
                tr.Commit();
            }
            wd.SubEntityTraits.Color = color.ColorIndex;


            Point3d startPt = axOriginPoint + new Vector3d(-w * m_Scale / m_CannoScale, 0, 0);
            Point3d endPt = startPt + new Vector3d(0, (maxEle - minEle), 0);
            wd.Geometry.WorldLine(startPt, endPt);


            int i = 0;
            for (double d = minEle; maxEle - d > 0.001; d += l * vs * 2 )
            {
                startPt = axOriginPoint + new Vector3d(-w * m_Scale / (2 * m_CannoScale), i * l * vs, 0);
                endPt = startPt + new Vector3d(0, l * vs, 0);

                Autodesk.AutoCAD.DatabaseServices.Polyline pl = new Autodesk.AutoCAD.DatabaseServices.Polyline();
                pl.AddVertexAt(0, new Point2d(startPt.X, startPt.Y), 0, w * m_Scale / m_CannoScale, w * m_Scale / m_CannoScale);
                pl.AddVertexAt(1, new Point2d(endPt.X, endPt.Y), 0, w * m_Scale / m_CannoScale, w * m_Scale / m_CannoScale);

                wd.Geometry.Polyline(pl, 0, 1);
                //pl.WorldDraw(wd);
                //pl.Dispose();

                i += 2;
            }

            return base.WorldDraw(drawable, wd);
        }
    }
如何调用上面的代码,
可以参照这个链接中的文章。
原文链接: https://www.cnblogs.com/myzw/p/13411628.html
欢迎关注
微信关注下方公众号,第一时间获取干货硬货;公众号内回复【pdf】免费获取数百本计算机经典书籍
原创文章受到原创版权保护。转载请注明出处:https://www.ccppcoding.com/archives/200966
非原创文章文中已经注明原地址,如有侵权,联系删除
关注公众号【高性能架构探索】,第一时间获取最新文章
转载文章受原作者版权保护。转载请注明原作者出处!